Google Trends for SEO: How to Read the Data and Turn It Into Content Ideas
Google Trends is free, and almost everyone who's done keyword research has opened it at some point. Far fewer people read it correctly. The number on the chart isn't search volume, "rising" doesn't mean "big," and a flat line for a low-volume term doesn't necessarily mean nobody searches for it. Misreading any of those leads to real mistakes: chasing a spike that's already over, or ignoring a keyword that's actually still growing.
This is how to read Trends data correctly and turn it into decisions, using the same running-shoes example from our SEO keyword research guide.
Step 1: Know What the Number Actually Means
The first thing to unlearn: the 0–100 line on a Trends chart is not search volume. Google's own documentation is explicit about this — data is normalized by dividing by the total searches in the time range and location you selected, then scaled from 0 to 100 based on a term's share of all searches, not given as a raw count. A term sitting at 40 doesn't mean 40 of anything measurable. It means the term's relative interest is 40 on a scale where 100 represents its highest point of popularity in the time range and location you selected.
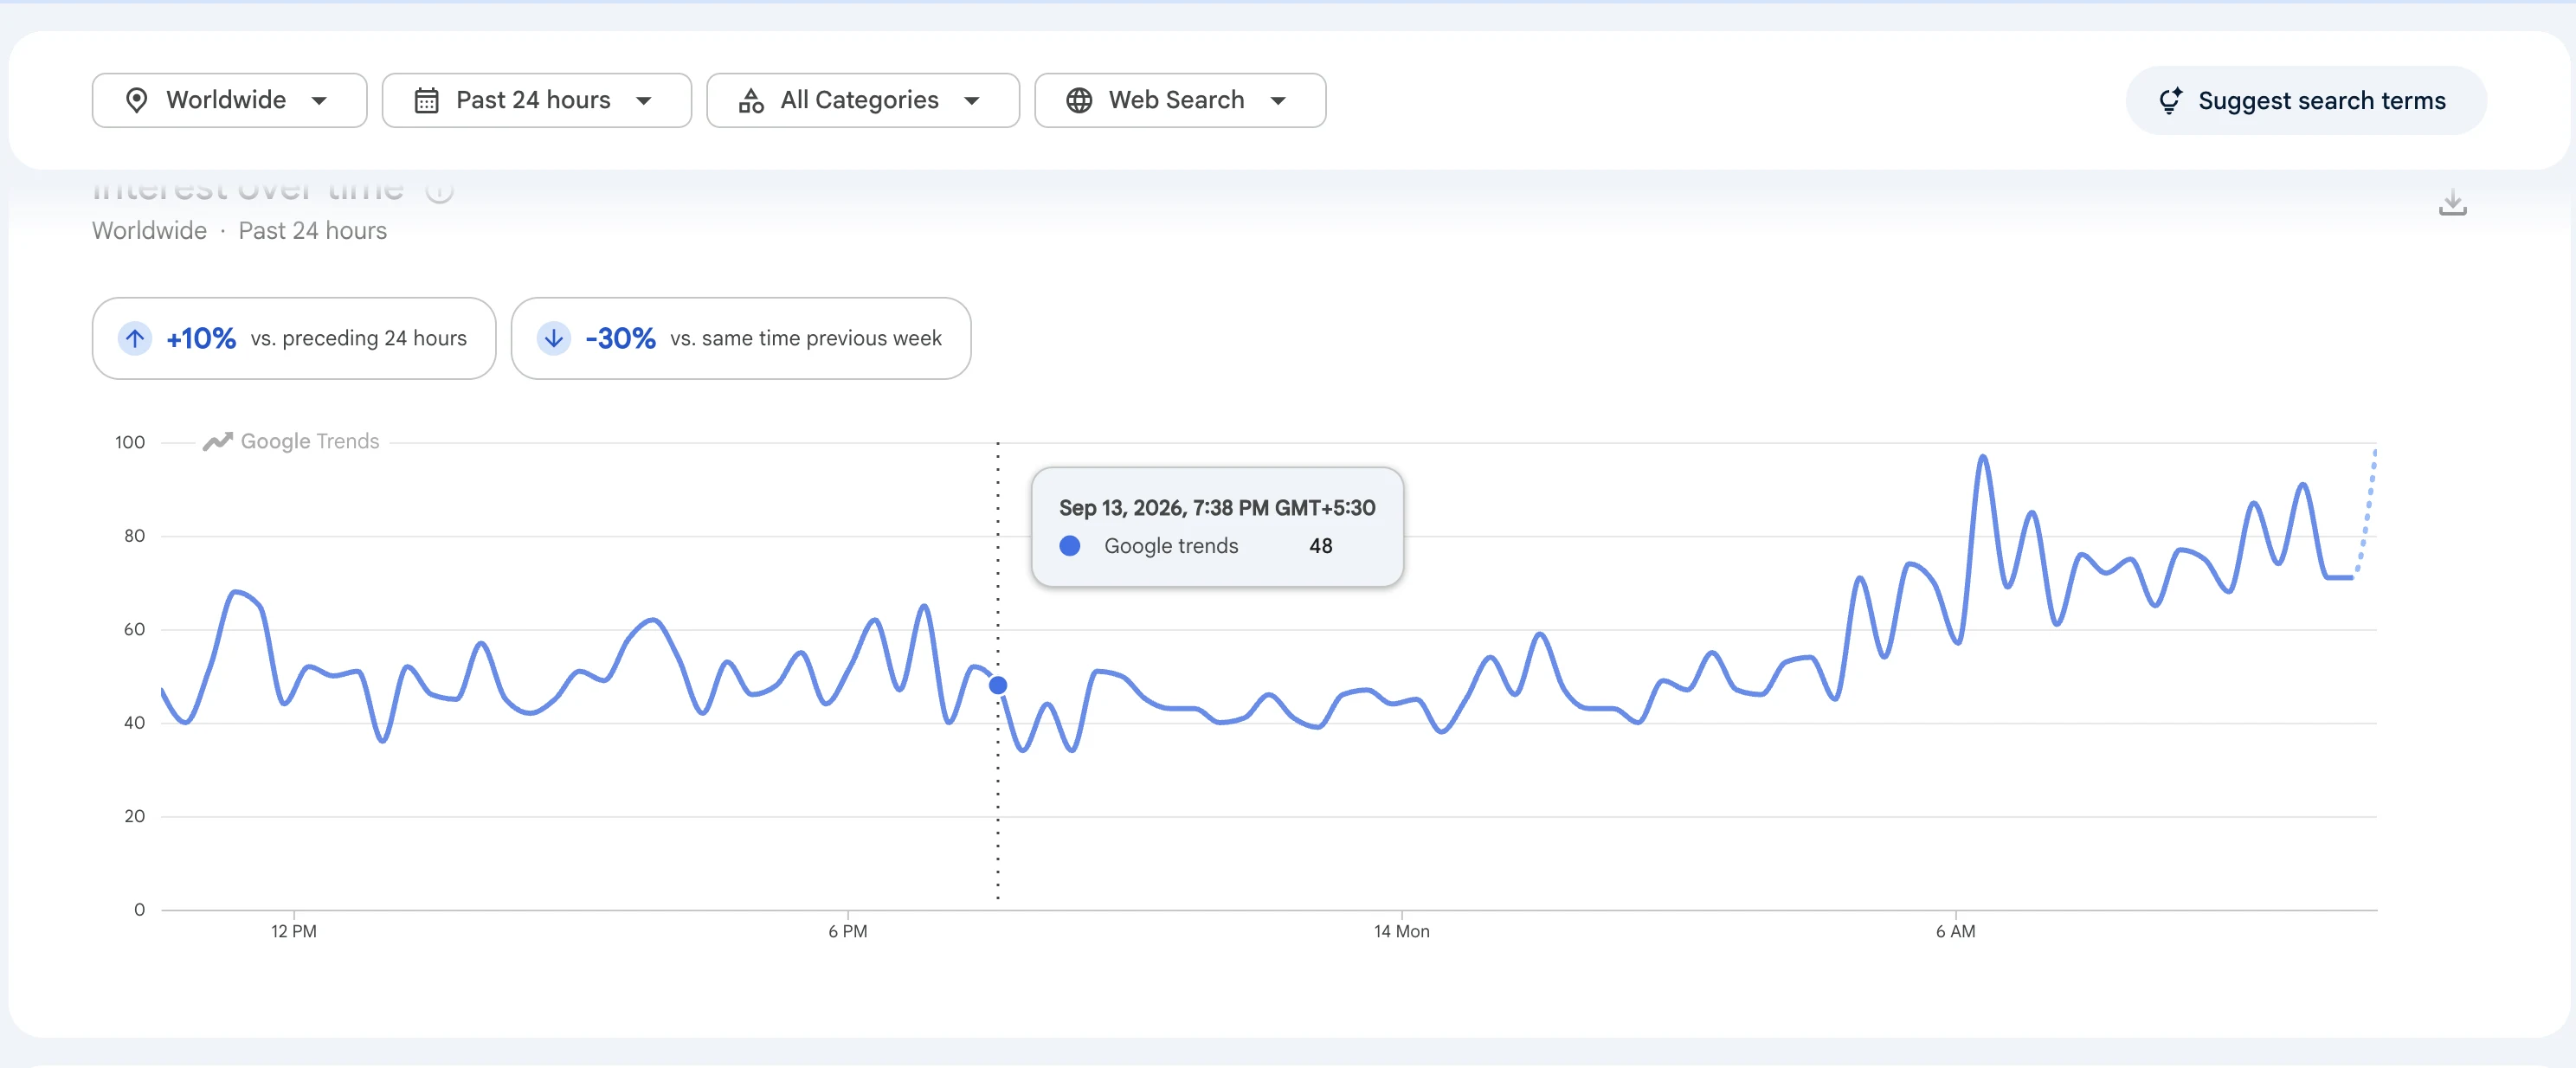
That has a direct consequence: you can't compare two separate single-term searches and conclude one has more volume than the other. A term scored 80 in one search and a different term scored 30 in another search aren't on the same scale, each chart is normalized to its own peak. To actually compare two terms, you have to search them together (Step 2).
The data itself comes from a sample, not every Google search, since Google processes billions of searches a day. Low-volume terms can show as a flat 0, not because nobody searches them, but because there isn't enough search activity for Trends to display meaningful data.
Step 2: Compare Keywords Properly
Type multiple terms into the same Trends search and they're plotted on a shared scale, with the highest point in the comparison set normalized to 100. That makes the comparison meaningful: the other terms are shown relative to that reference point.
You can compare far more than most people realize. Trends now supports up to 8 groups of terms at once, with up to 50 terms in each group, well beyond the "5 terms" limit that's still repeated in a lot of older SEO content.
For "running shoes," you might compare it against "trail running shoes," "marathon shoes," and "running sneakers" to see which phrasing actually carries more relative interest in your target country, rather than guessing which one to lead with in a title.
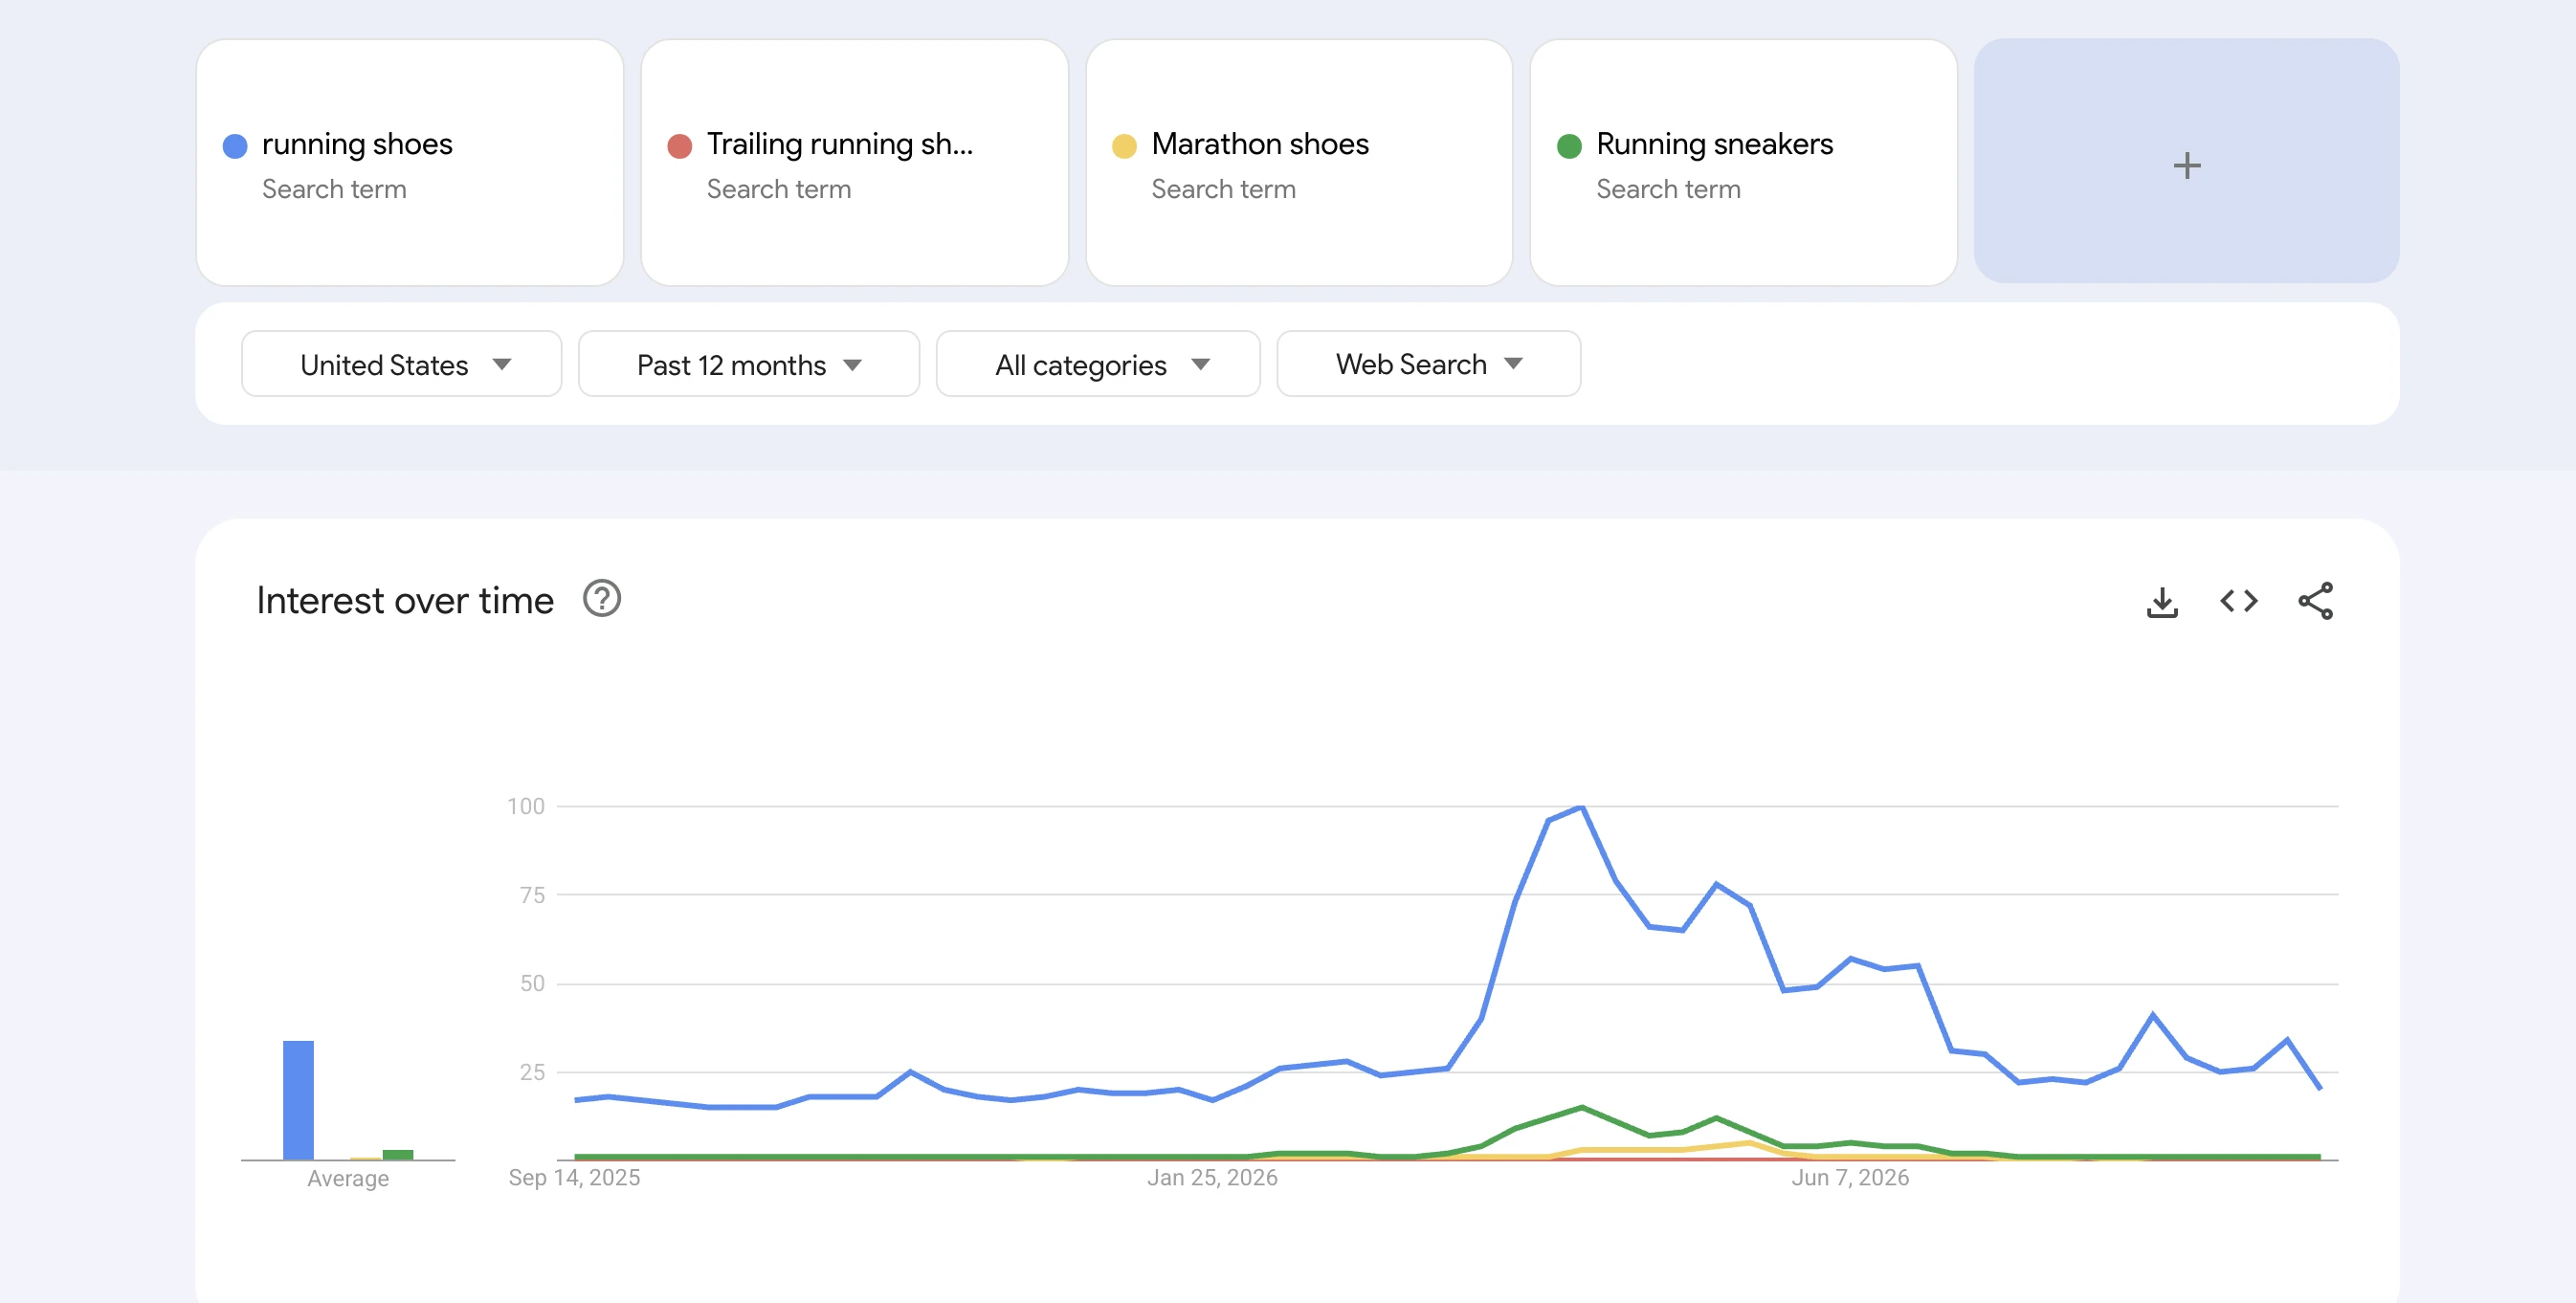
The same comparison approach works for brand-level decisions. Search two competing brand terms — "Brooks" against "Hoka," for example — together instead of separately, before writing something like a "Brooks vs. Hoka" comparison page (see our SEO keyword research guide). Trends won't tell you which brand converts better, but a side-by-side chart tells you which one currently carries more relative search interest in your target market, which is useful context before deciding which brand to lead with in the page's title.
Step 3: Understand Search Terms vs. Topics
Trends lets you search two different kinds of things, and they measure different questions.
A search term is the exact word or phrase someone typed, nothing more. Search it and you only get data for that literal wording. A topic is a group of related searches Google has mapped to the same real-world concept, using its Knowledge Graph, and it can include different spellings, phrasings, and even languages that all point to the same thing.
Google generally suggests choosing a topic when one is available, since it gives a more complete picture of interest in the underlying subject rather than just one way of phrasing it. Search terms are still the better choice when you specifically care about the exact wording, comparing "running shoes" against "running sneakers" as distinct phrasings, for instance, or researching a specific product name or brand term Trends hasn't mapped to a broader topic.
If a term has multiple meanings, Trends also lets you filter results to a specific category to get data for the right one, for example separating "jaguar" the animal from "jaguar" the car brand instead of measuring a blend of both.
Step 4: Read Rising and Breakout Queries Correctly
Below the main chart, Trends shows related queries and topics in two lists: Top and Rising. These measure different things, and mixing them up is an easy mistake.
Top queries are the terms most frequently searched with the term you entered during the selected period. This is closer to "what people commonly search around this topic" than a measure of growth.
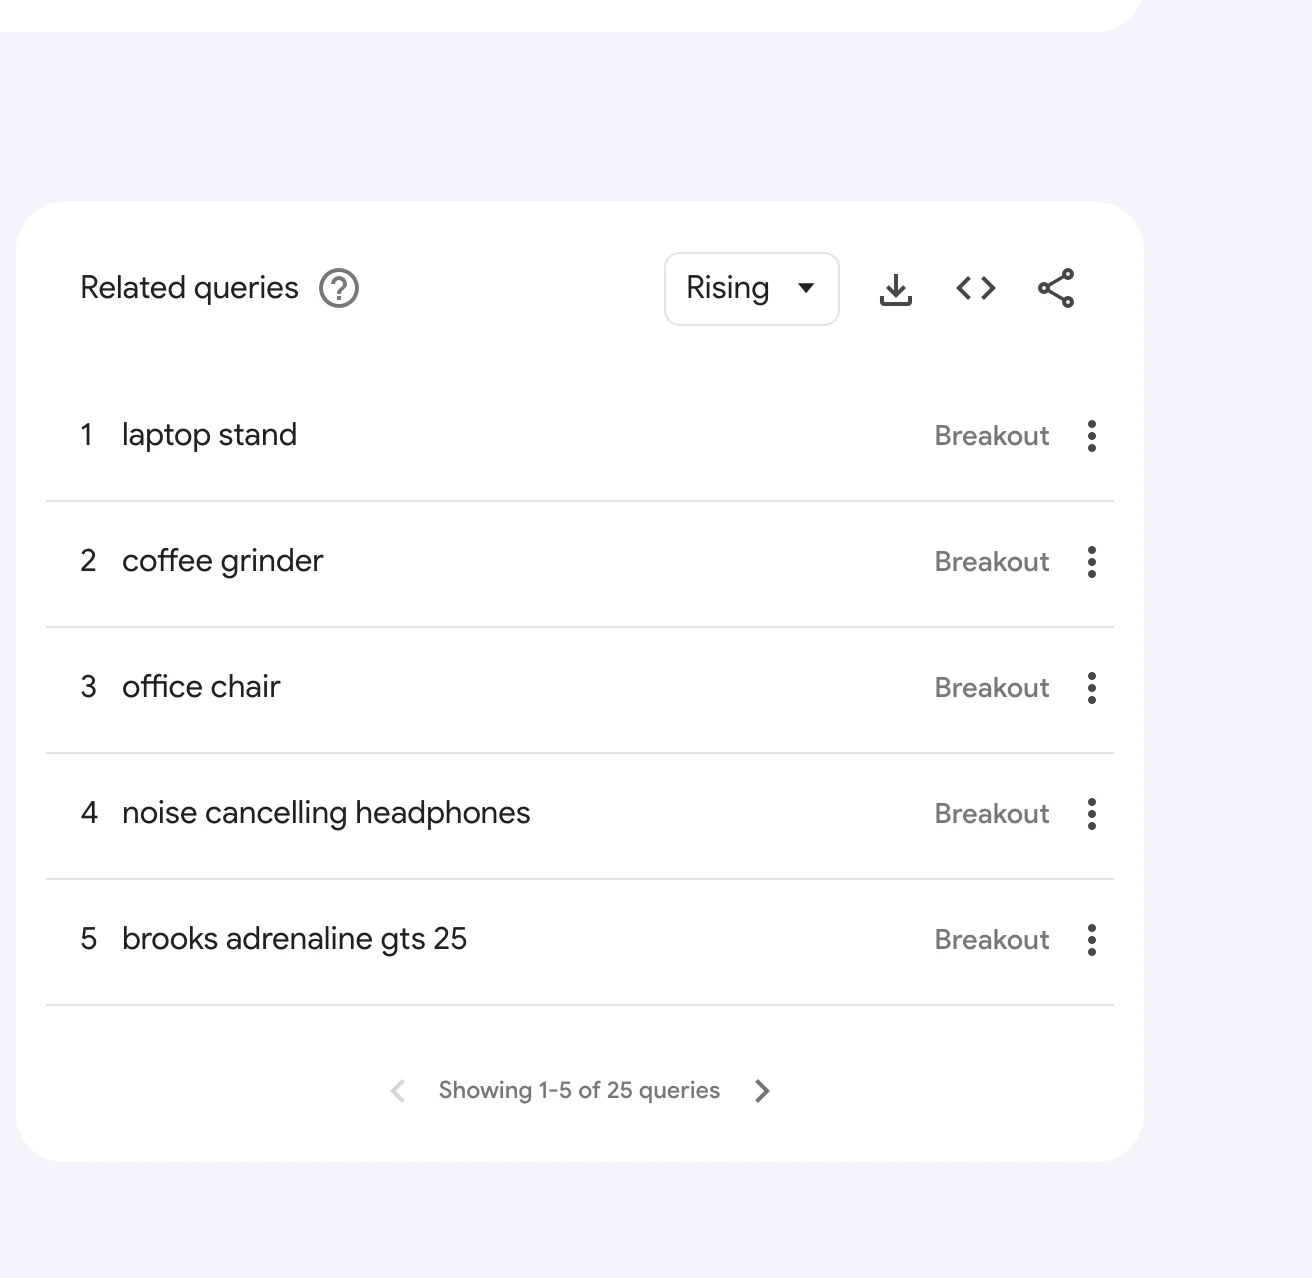
Rising queries show the biggest percentage growth in a term over the previous period, not the biggest volume. A term can appear in Rising with a small absolute audience, as long as it grew fast relative to where it started. When growth passes 5,000%, Trends replaces the percentage with the label "Breakout" instead of a number, since a percentage that large stops being a meaningful figure.
The mistake worth avoiding: treating a Breakout label as proof of a big keyword. It's proof of a fast-growing one, which is a different and sometimes much smaller thing. Check the absolute context, not just the label, before building a content plan around it.
Step 5: Check Seasonality Before You Commit to a Topic
Trends provides enough historical data to see whether a topic is a one-off spike or a genuine yearly pattern. Set the range to "past 5 years" or longer and look for a repeating shape, not just a single peak.
For example, if "running shoes for shin splints" shows the same spring spike every year in Trends, that's a plausible sign people are restarting training after winter, not something unusual happening that particular year. If a topic reliably peaks the same months every year, that's a scheduling insight: publish or refresh the page before the season starts, not after it's already peaking, since content needs time to get crawled and evaluated.
A topic with no repeating pattern and one isolated spike is a different case, worth treating as a one-time event rather than something to plan an annual content calendar around.
Step 6: Check Geographic Trends
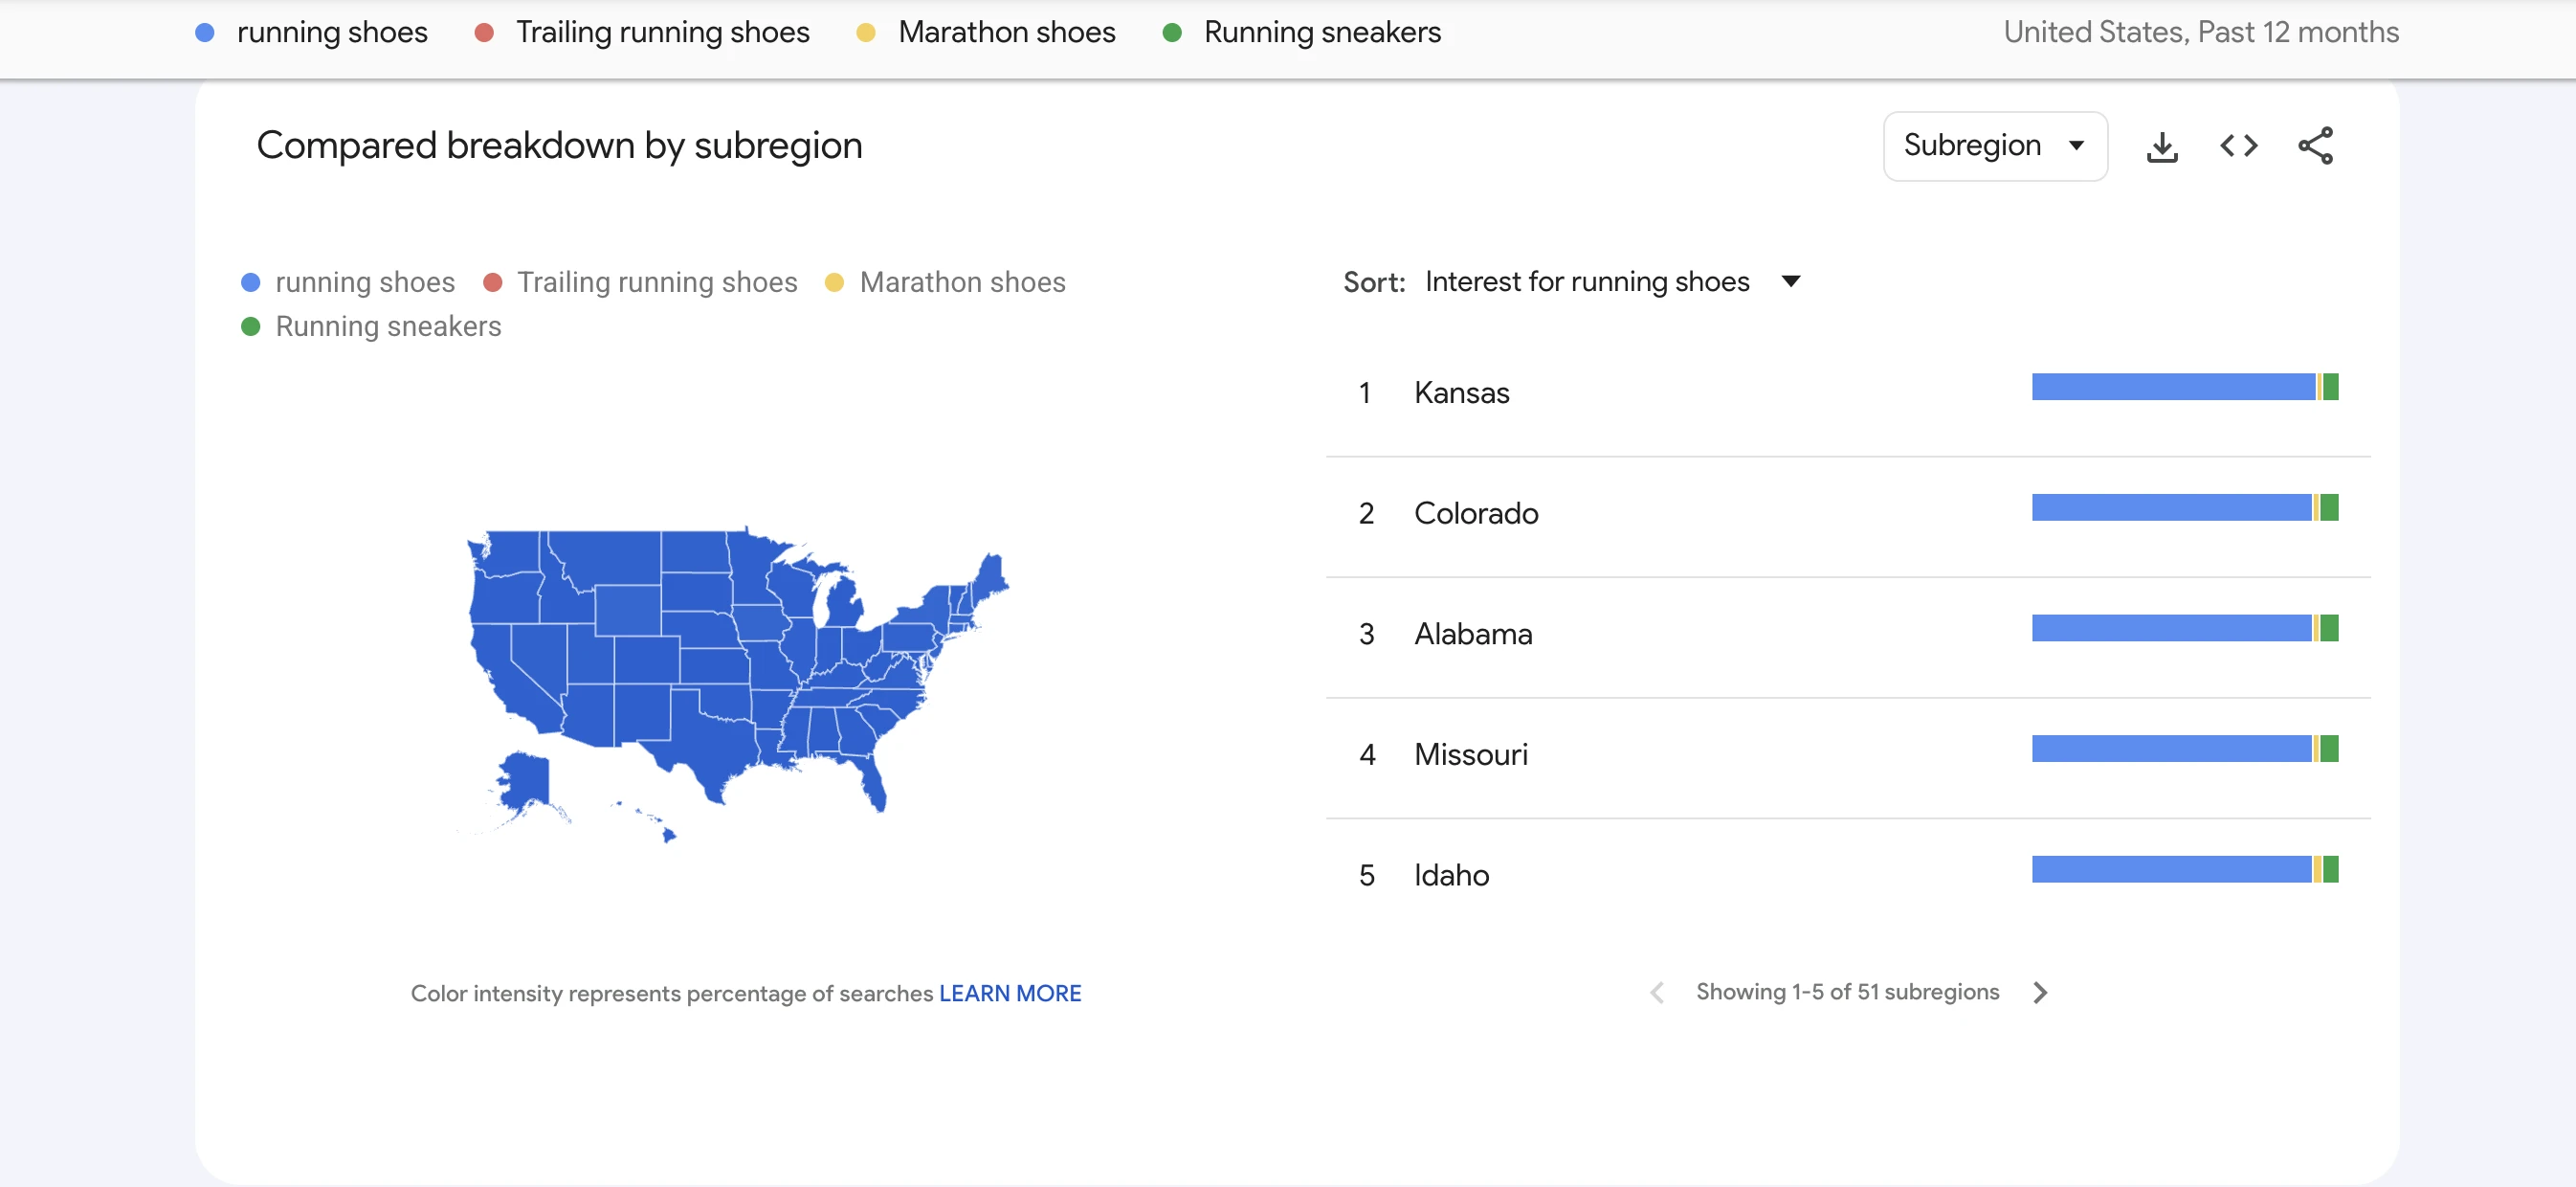
The same search term can carry very different relative interest in different places. Trends breaks interest down by country, and within a country, down to the state/region and, where available, city level.
This matters most if your business or content targets a specific country or region rather than a global audience. A topic with strong overall interest might be carried almost entirely by one country's search activity, worth knowing before you assume it represents your actual market. For a location-specific business, checking the geographic breakdown can also surface which cities or regions are worth a locally-focused page, rather than one general page assumed to serve everyone equally.
Step 7: Find Emerging Topics and Use Trends Alongside Volume Data
Trends is good at answering a question keyword-volume tools generally aren't built for: is interest in this topic growing, flat, or shrinking right now? A keyword tool's monthly search volume number is useful for sizing a keyword, but it may not reflect a topic's recent rise or fall as quickly.
Neither tool replaces the other. A keyword tool tells you roughly how big a topic is. Trends tells you which direction it's currently moving. Used together: start from your seed keywords (see our SEO keyword research guide), then check Trends for any that show a clear upward or downward trend before you commit real effort to targeting them, rather than treating every keyword on a list as equally worth pursuing right now.
Watching the "Rising" list under a broad seed term over time can sometimes surface growth before a keyword tool's estimated monthly volume has meaningfully changed, since Trends can pick up on a shift before enough total search history exists for a volume estimate to fully reflect it.
Use Trending Now for Very Recent Opportunities
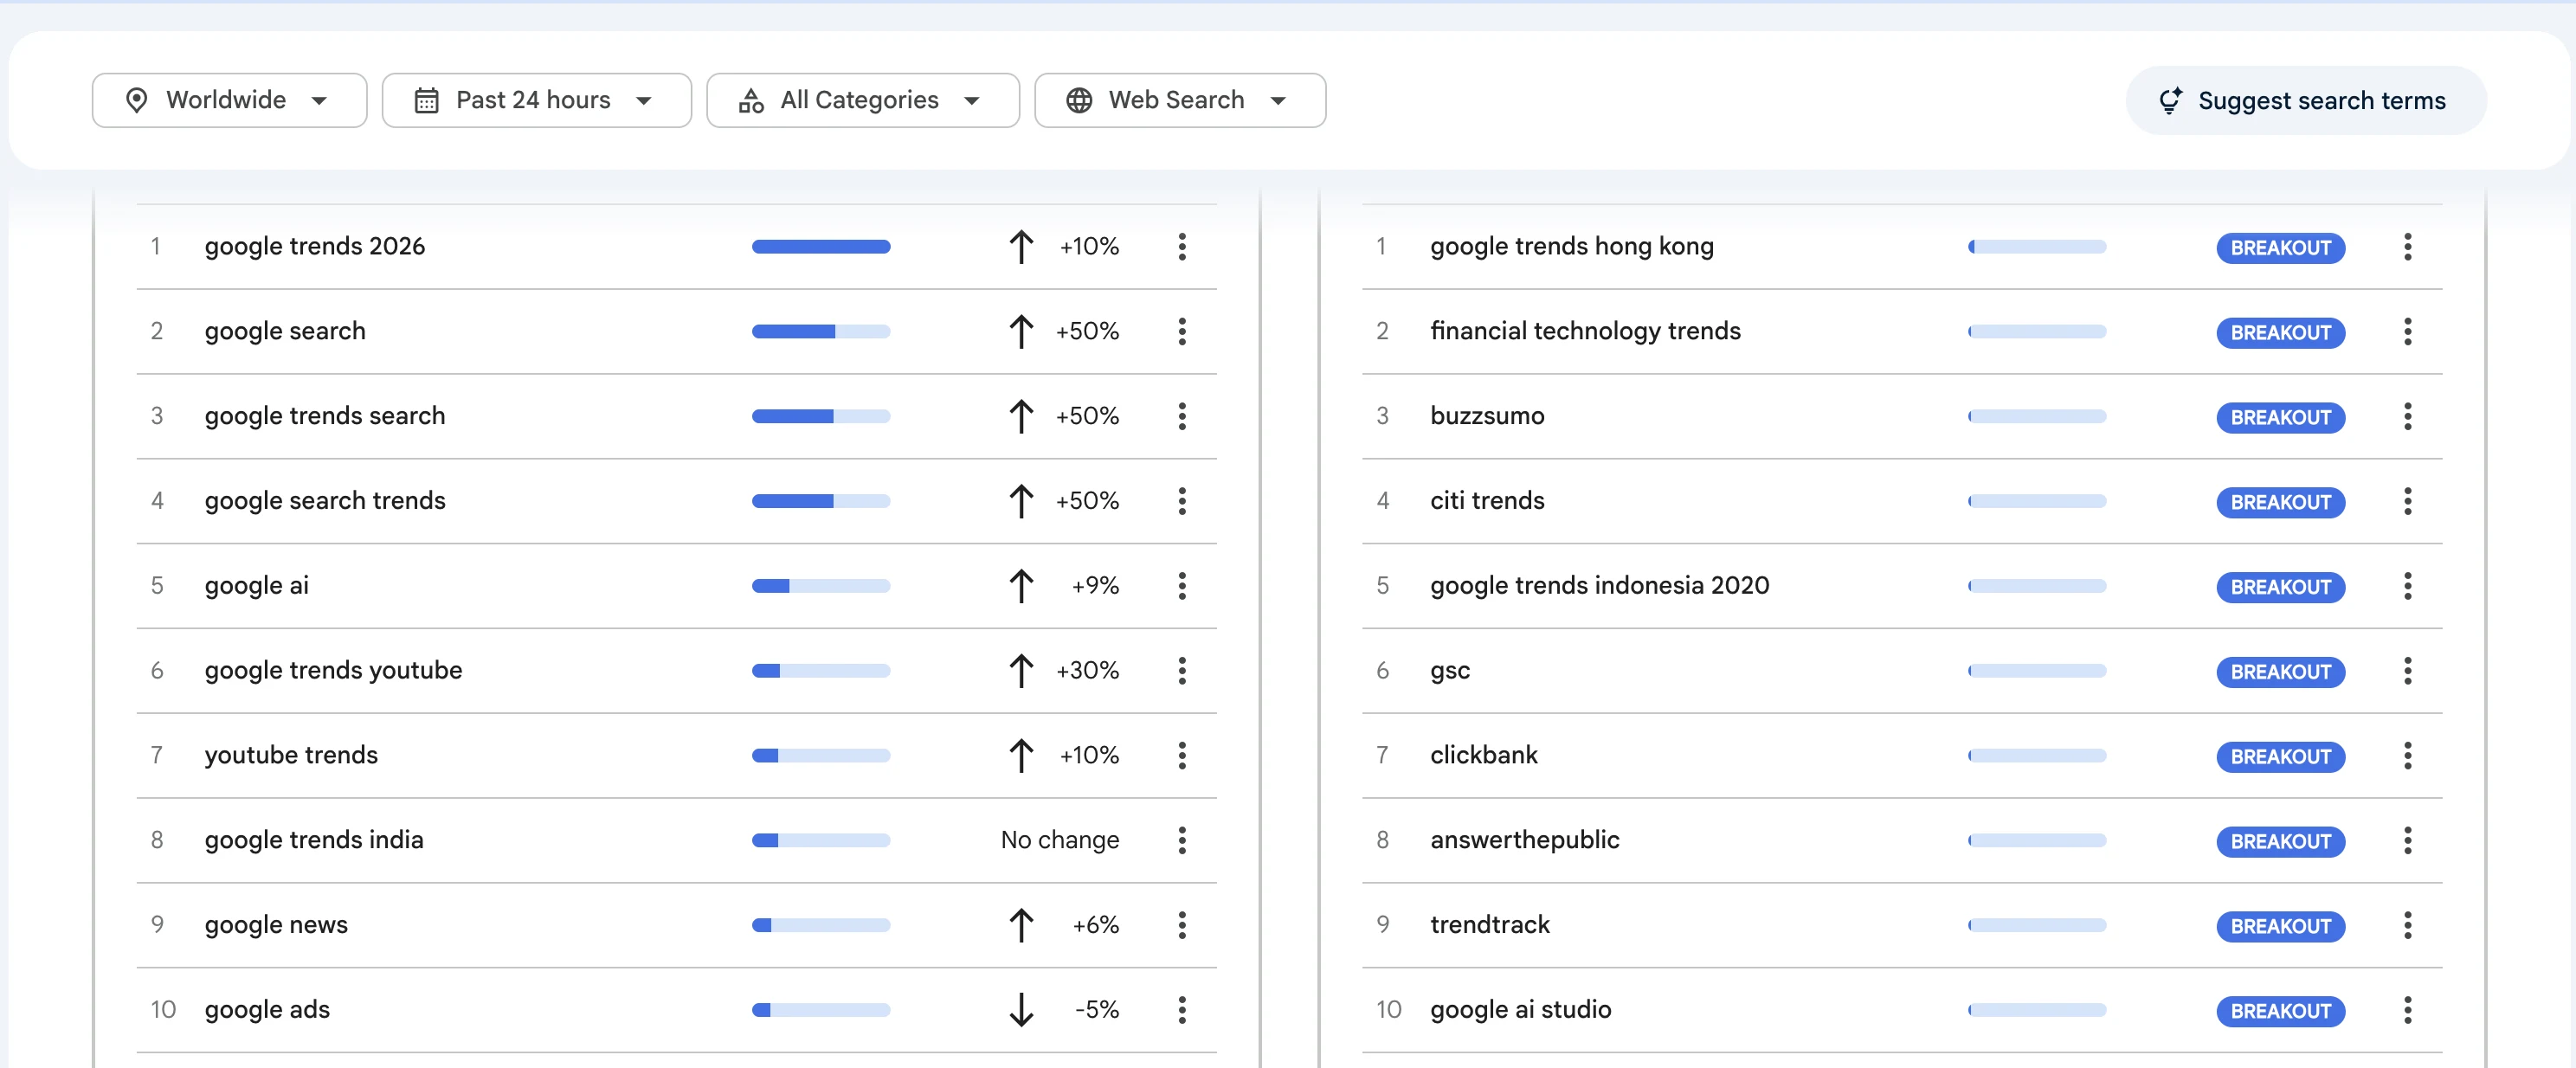
Everything above is the Explore workflow, built for research over weeks, months, or years. Trends also has a separate Trending Now view, for a different question entirely: what's moving right now. It covers 100+ countries and regions, refreshes roughly every 10 minutes on average, and lets you look at the past 4 hours, 24 hours, 48 hours, or 7 days. It uses an exact-match chart and focuses on recent search surges, often around news stories, so it's useful for time-sensitive content rather than the longer-term pattern research covered in the rest of this guide.
Step 8: Turn Trends Data Into Actual Content Ideas
Data without a next step isn't useful. A few concrete ways to act on what the steps above surface:
- A Rising (not just Breakout) query with real, sustained growth over several weeks, not a single-week spike, is a candidate for a new page or a timely update to an existing one.
- A confirmed seasonal pattern (Step 5) becomes a publishing calendar entry: refresh or promote that page a few weeks before its season starts.
- A geographic concentration (Step 6) you weren't accounting for is a reason to consider a region-specific page or section, if your business actually serves that region.
- A term that shows consistently strong interest across years, with no strong seasonal pattern, is more likely to behave like an evergreen topic — but that's still a reason to check real search volume and how competitive the SERP actually is (see our SEO keyword research guide), not a reason to commit on Trends interest alone.
For the running shoes example: if "running shoes for shin splints" shows the same spring spike every year in Trends, that's a real, checkable reason to schedule that page's refresh for late winter, not a guess.
Check the Search Type Before Picking a Format
Every Trends chart defaults to "Web Search," but that's one filter among several, not the whole picture. Switch it to Image Search, News Search, Google Shopping, or YouTube Search and you get relative interest within that specific search type instead. If a topic shows meaningfully higher relative interest in YouTube Search than in Web Search, that's a real signal worth weighing before defaulting to a blog post — a video, or at least a page built around embedded video, may match the way people are actually looking for it.
A Quick Google Trends for SEO Checklist
Before you act on something you saw in Trends, you should be able to say yes to:
- You know the number is relative interest, not search volume, and haven't compared two separate single-term charts against each other.
- You compared the terms you actually care about together, on one shared chart, rather than judging them from separate searches.
- You used a topic instead of a term when one was available and you cared about the broader concept, not one exact phrasing.
- You checked whether a Rising or Breakout query has real sustained growth, not just a single-week spike.
- You checked several years of history for a seasonal pattern before treating a spike as one-off or as recurring.
- You checked the geographic breakdown if your business or content is region-specific.
- You paired what Trends showed with an actual volume number from a keyword tool before deciding a topic is worth the effort.
Make Trend-Spotting Faster With RankAnalyze
Google Trends is free, but it tells you whether interest in a topic is moving, not whether you can realistically win it. Once Trends identifies a topic worth investigating, Ranking Audit can help assess the page's existing topic coverage and keyword difficulty, while Head-to-Head can help identify competitor keyword gaps.
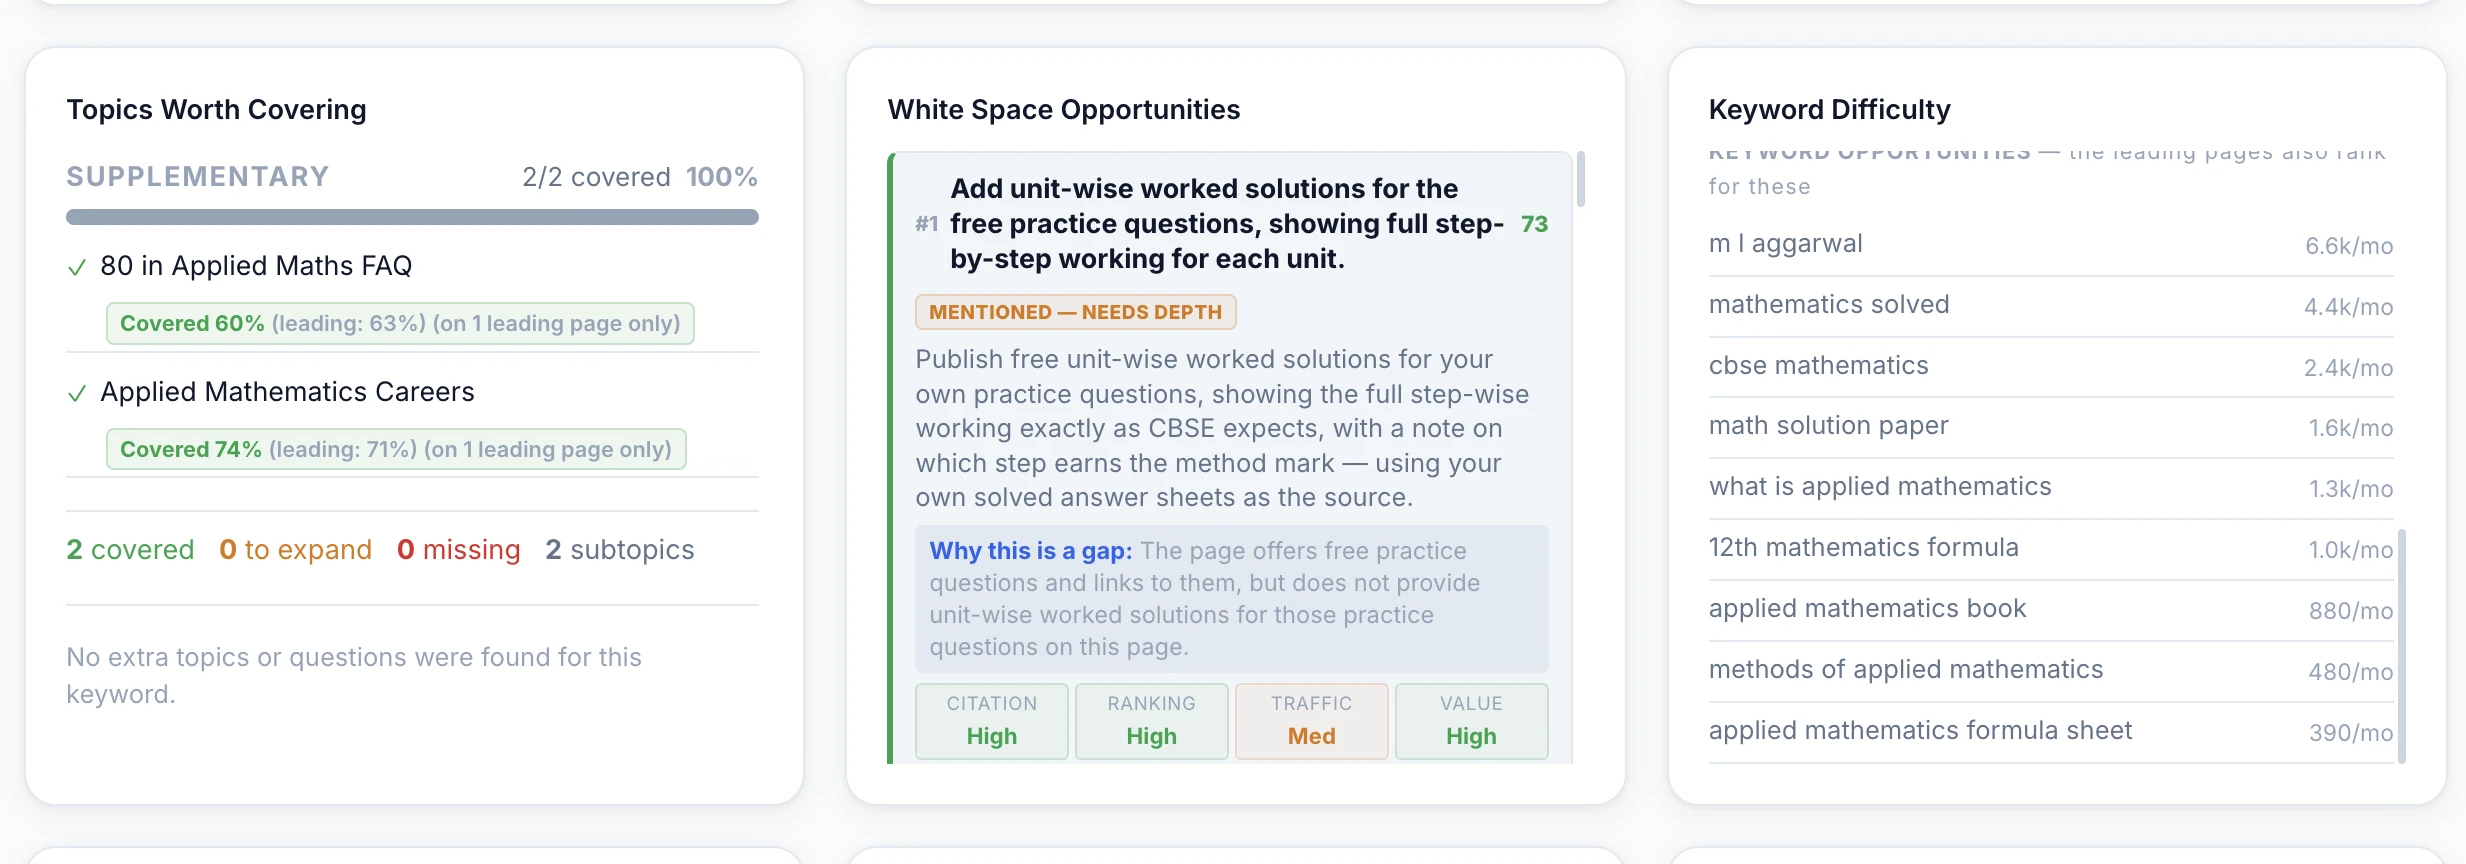
RankAnalyze's Ranking Audit and Head-to-Head turn a Trends signal into a real plan: topic coverage, white space, keyword difficulty, and exactly which keywords a competitor ranks for that you don't.
Frequently Asked Questions
Is Google Trends data the same as search volume?
No. Trends shows relative interest on a 0–100 scale, normalized against the total search activity in the time range and location you selected. It doesn't show an actual number of searches. For an actual volume estimate, you need a keyword research tool, not Trends.
Why does a keyword show as flat 0 on Google Trends?
Trends only shows data for terms popular enough to register in its sample. A flat 0 may mean the term's search volume is too low for the sample to pick up reliably, not that literally nobody searches it.
What's the difference between a search term and a topic in Google Trends?
A search term measures only the exact phrase you typed. A topic groups related searches around the same real-world concept, including different spellings, phrasings, and languages. Google generally suggests using a topic when one is available, unless you specifically care about one exact wording.
What's the difference between a "Rising" and a "Breakout" related query?
Rising shows a percentage growth figure for how much a term's search interest increased over the previous period. Breakout replaces that percentage once growth passes 5,000%, since a number that large stops being meaningful as a percentage. Neither label tells you the term's absolute size, only how fast it grew.
Is Google Trends free to use?
Yes. Google Trends is free to use.
See exactly how ChatGPT, Claude, Gemini, Perplexity and Copilot describe you today.